A common question regarding the current state of the economy and insolvency is: “How much longer do we have left of this?” Over the past three years, insolvency activity has risen significantly, reflecting the challenging economic and trading conditions many businesses face. Unsurprisingly, many are now wondering when some of that pressure might finally begin to ease.
Although it is difficult to forecast what the economy as a whole may do, we can use historical data to forecast the insolvency market, which is closely correlated to the state of the economy.
The Method: Multiple Linear Regression
To forecast we look back at the historical relationship between liquidation volumes and the key economic drivers that move them, and we use that relationship to project forward.
The method we have used is multiple linear regression. In plain terms, this means we identified the variables that have historically moved in lockstep with liquidation numbers, quantified the strength of those relationships, and then plugged in forward-looking estimates of those variables to generate a forecast.
The three drivers of insolvency
The official cash rate (lagged 18 months). When the RBNZ raises interest rates, businesses do not fail immediately. They draw down reserves, defer creditor payments, and run on goodwill. The pain tends to crystallise 12 to 18 months later when fixed-rate debt reprices, working capital runs out, and the IRD starts asking questions. The OCR peaked at 5.5% in May 2023 and held there for 15 months. If you wind the clock forward 18 months from that peak, you land squarely in the middle of the 2024–2025 liquidation surge. That is not a coincidence.
The unemployment rate. Unemployment is our proxy for aggregate demand. When people lose jobs, they spend less. When they spend less, the businesses serving them (retail, hospitality, services) come under pressure. The December 2025 unemployment rate of 5.4% was the highest since 2015, and its correlation with rising liquidation volumes is clear in the data.
The IRD tax debt book. The total amount of outstanding tax owed to Inland Revenue is a measure of how much latent financial stress is sitting inside the business population. That figure grew from approximately $6 billion in 2022 to over $9 billion by mid-2025, and IRD’s enforcement posture, backed by an additional $35 million in Budget 2025, means that debt is now being actively pursued. IRD accounted for 63% of all winding-up applications in 2024, and maintained a 31-month consecutive streak of filing more applications than all other creditors combined.
Together, these three variables explain approximately 90% of the year-to-year variation in New Zealand liquidation volumes over the past decade (R² = 0.898). That is a strong result, and it gives us reasonable confidence that the model captures the real dynamics at play.
The forecast: Three scenarios
Rather than offering a single point forecast which would imply a precision we do not have, we modelled three scenarios, each reflecting a different view of where the drivers are headed.
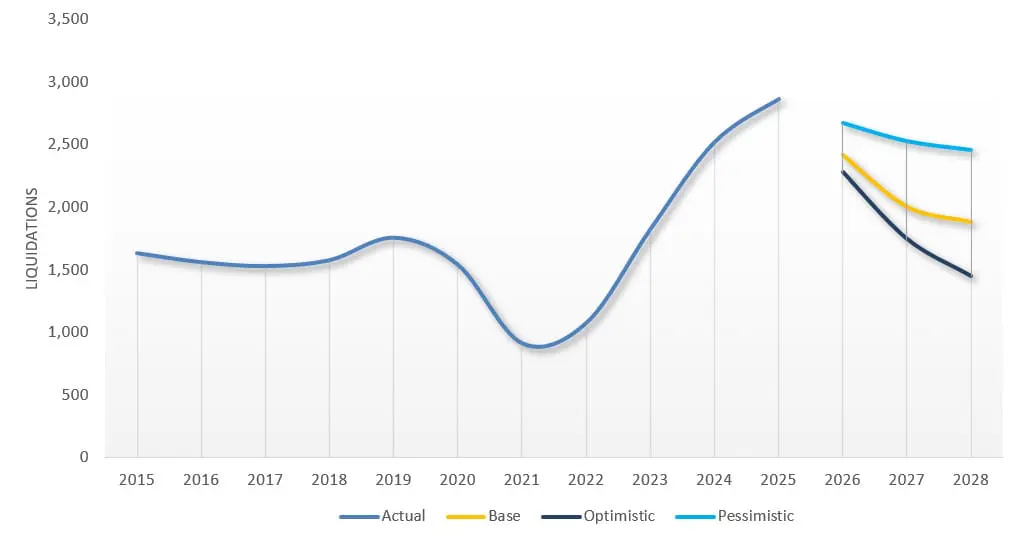
The base case assumes the current trajectory continues: OCR cuts flow through gradually, unemployment peaks and edges down, and the IRD debt book grows slightly as new arrears offset collections. Under this scenario, liquidations fall from 2,867 in 2025 to approximately 2,420 in 2026, 2,000 in 2027, and 1,880 in 2028.
The optimistic case assumes a faster recovery: monetary transmission is quicker than expected, the labour market improves materially, and IRD makes meaningful progress reducing its debt book. Under this scenario, liquidations fall to around 2,280 in 2026, 1,750 in 2027, and 1,450 in 2028.
The pessimistic case assumes the headwinds persist: unemployment stays elevated, the construction sector generates a second wave of failures, and IRD enforcement intensifies further. Under this scenario, liquidations remain above 2,500 through 2026 and 2027, only beginning to ease toward 2,460 in 2028.
What this means in practice
A few things in the forecast stand out as worth considering.
First, even under the optimistic scenario, 2026 liquidation volumes remain well above the pre-pandemic average of around 1,600 per year. The idea that the market snaps back quickly to historical norms is not supported by the data.
Second, the year with the most meaningful decline across all three scenarios is 2027. That is the point at which the 18-month lag from the 2025–2026 OCR cuts begins to flow through in earnest, unemployment is projected to have peaked, and the IRD enforcement pipeline – which runs on a 6 to 12 month delay from negotiation, to application, to appointment – begins to thin. For businesses currently in distress, 2027 may represent the first genuine easing of external pressure. But for many, that is a long time to hold on.
Third, the spread between our optimistic and pessimistic forecasts is wide – approximately 1,000 liquidations per year by 2028. That uncertainty is honest and intentional.
As recent events in Iran have highlighted, there is a wide range of global factors at play that no forecasting model can fully account for. Ongoing uncertainty around fuel prices and broader supply chain costs remains very real, and in our view, the full impact of these pressures has yet to flow through into insolvency appointment numbers, though we expect this may become more visible over the next few months. The broader point is that anyone offering a precise, single-number forecast for insolvency volumes in 2028 is likely overstating the certainty of the outlook and underestimating how sensitive New Zealand’s economy remains to global events.
The Bottom Line
To return to the question we started with; how much longer does this go on? – our best answer, supported by the data, is: the worst is likely behind us, but the recovery will be gradual and uneven. 2026 will remain a high-volume year, likely on par with 2025. 2027 should see a more meaningful easing. By 2028, under most scenarios, we are back within sight of a more normal market – though still above the lows of the 2020–2022 period, which were artificially suppressed by government support measures and an IRD that was not actively enforcing.
For directors and business owners navigating this environment, the outlook offers at least some perspective. In certain industries, a slowdown in liquidations may signal improving demand. In others, it may simply reflect that the number of businesses operating in the market has reduced to better match softer trading conditions. Either way, the businesses most likely to come through strongly are typically those that act early, restructuring where needed, engaging proactively with creditors, and seeking advice before the available options begin to narrow.