The US is New Zealand’s third-largest trade partner, accounting for 12.6% of our annual global trade. Aside from being the largest economy in the world (GDP 30.6 trillion USD, 2025), it is at the forefront of geopolitics and technological innovation.
As the Global Financial Crisis has taught us, the US’s financial state can have profound repercussions for the NZ economy. With a growing national debt at 38 trillion USD, a risk exists for accelerating inflation, aggressive foreign affair polices, and a K shaped economy where higher income sectors grow, while lower income sectors decline. It therefore pays for Kiwis to take a look into the insolvency state of the US in preparation for what will likely be turbulent times ahead.
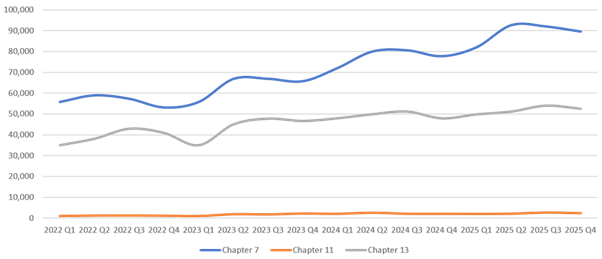
Insolvencies in the United States fall into various bankruptcy chapters. The most common of which are in the graphed above.
Chapter 7 – Liquidation
The US liquidation process is broadly similar to that under the Companies Act 1993 in NZ.
- Appointment of an independent officeholder
- Asset realisation and creditor distributions
- Statutory priority waterfall
- Investigation of voidable transactions
US liquidations are predominantly handled by the court (as opposed to NZ, where approx. 70% are shareholder-nominated and principally led by Insolvency Practitioners). Liquidation can also apply to individuals’ estates, unlike in NZ, where it is strictly for limited entities, with personal estates left to our Insolvency Trustee Service led bankruptcy regime.
Chapter 11 – Reorganisation
A debtor-in-possession restructuring process. Management typically remains in control while proposing a court-approved plan to compromise debts and restructure the balance sheet. The closest analogue to NZ procedures is Voluntary Administration (Part 15A of the Companies Act 1993), although it is more debtor-driven and court-intensive than NZ’s more practitioner-led processes. Most often used by larger businesses, traditional restructuring takes 6 to 18 months, much longer than the typically 1 to 1.5 months of many NZ VAs.
Chapter 13 – Individual repayment plan
Available to individuals with regular income. Debtors retain assets but commit to a structured repayment plan. The closest NZ comparisons include Summary instalment orders, Debt repayment orders, or informal creditor compromises.
Trends in insolvencies and macro conditions
In aggregate, bankruptcies have risen materially from Q1 2022 to Q4 2025.
- Chapter 11 filings totalled 4,912 in 2022 and increased by 87%, reaching 9,191 filings in 2025.
- Chapter 7 filings rose by 58% over the same period, totalling 356,321 filings in 2025.
- Chapter 13 filings increased by 32% from 2022 to 2025, with 207,654 filings recorded in 2025.
Despite these figures, real GDP data for the third quarter of 2025 showed solid growth, with output expanding at around 4.3–4.4% annualised, far exceeding NZ’s 1.1% growth for the same period.
So what’s causing this rise?
Why is there a rise in bankruptcies?
Following the post-COVID stimulus period, the Federal Reserve began one of the most aggressive rate-hiking cycles in the Country’s history in March 2022 to combat elevated inflation. This rapid increase in borrowing costs has progressively filtered through to both corporate and household balance sheets. On the consumer side, record credit card balances, rising delinquencies, auto loan stress, the resumption of student loan repayments, and persistent cost-of-living pressures have eroded disposable income. Consumer bankruptcy filings typically lag credit deterioration by several quarters, which is consistent with the steady rise in Chapter 7 liquidations and Chapter 13 repayment plans since 2023.
At the corporate level, higher rates have driven refinancing stress, particularly in commercial real estate and among private equity-backed businesses that were leveraged during the ultra-low-rate era. Tighter regional bank lending standards and weaker capital markets have further constrained liquidity, accelerating Chapter 11 restructurings. Some of the increase also reflects a normalisation from artificially suppressed filing levels during 2020–2022, when stimulus and forbearance temporarily reduced insolvency activity.
Alikeness to NZ
While New Zealand has experienced a similar post-COVID tightening cycle, the transmission dynamics differ in scale and structure. NZ insolvency trends are being driven more heavily by SME cashflow pressure, construction sector stress, and higher floating-rate mortgage exposure, rather than large-cap leveraged restructurings or capital markets-driven Chapter 11 equivalents. Unlike the U.S., New Zealand does not have a deep corporate bond or private equity refinancing wall, so distress tends to manifest more quickly in liquidations rather than prolonged court-led restructurings. At the same time, household insolvency pressure in NZ remains more closely tied to mortgage servicing costs and small business viability, reflecting a more bank-centric and property-exposed economic structure.
What should Kiwi’s look out for in the US?
New Zealand remains sensitive to U.S. economic conditions through global funding markets, trade flows, and investor sentiment. A material U.S. recession, rising unemployment, or escalation in commercial real estate and regional banking stress could tighten global credit conditions, widen funding spreads, and strengthen the USD – pressuring the NZD and increasing imported inflation. Given NZ banks’ reliance on offshore wholesale funding and the country’s high household leverage, tighter global liquidity could lift borrowing costs domestically even without further RBNZ hikes. Kiwis should closely monitor U.S. labour market trends, high-yield credit spreads, banking stress, and broader equity market volatility, as these often precede spillover effects into smaller, open economies like New Zealand.